Currently Empty: $0.00


Pitch Type Distribution
Using pitch-level data from two games I produced self-explanatory graphs and tables to summarize the players’ performance in those two games.
Bar graph insights:
Fastballs (FF) were the most frequently used pitch in both games, with similar usage across Game 1 and Game 2.
• Sliders (SL) and curveballs (CU) were more commonly used in Game 1 than in Game 2.
• Changeups (CH) and sinkers (SI) had higher usage in Game 1 compared to Game 2.
• Cutter (FC) usage was more prevalent in Game 1, while the knuckle curve (KC) was rarely used in either game.
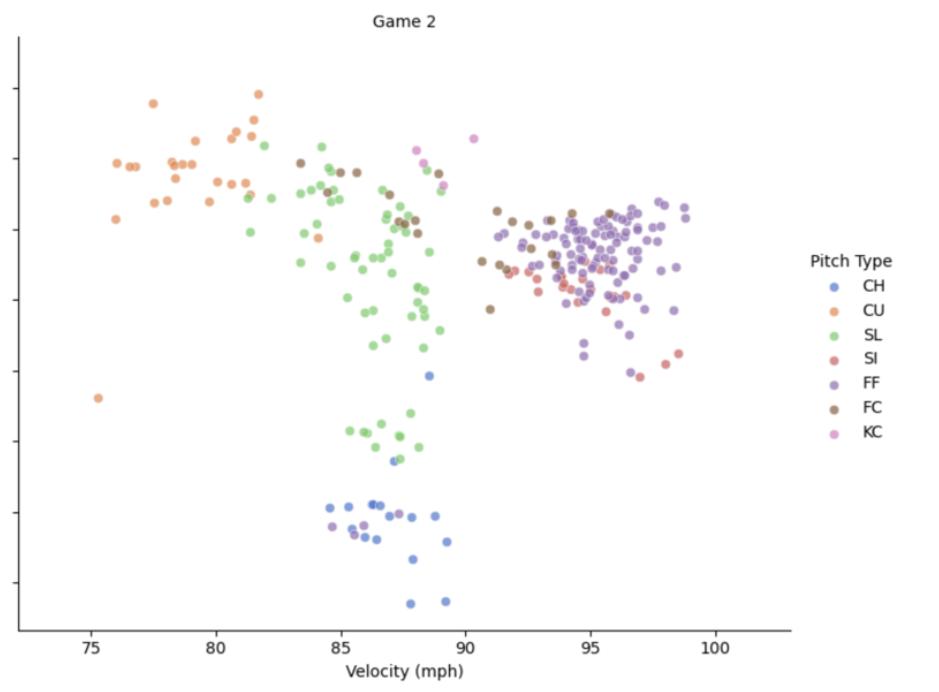
Scatter plot insights:
• The highest spin rates in Game 1 were on Cutters (FC), where the highest spin rates in Game 2 were on Changeups (CH).
• Average Slider (SL) spin rate was higher in Game 1 compared to Game 2.
• Fastball (FF) velocities are clustered very similarly in Game 1 and Game 2.
• There was a much wider range of velocities for Changeups (CH) in Game 1, ranging from the low
80s to the 90s, whereas Game 2 had a more consistent range between 82-85 mph.