Currently Empty: $0.00


Interactive Shot Chart – Angular Front End / Django Back End
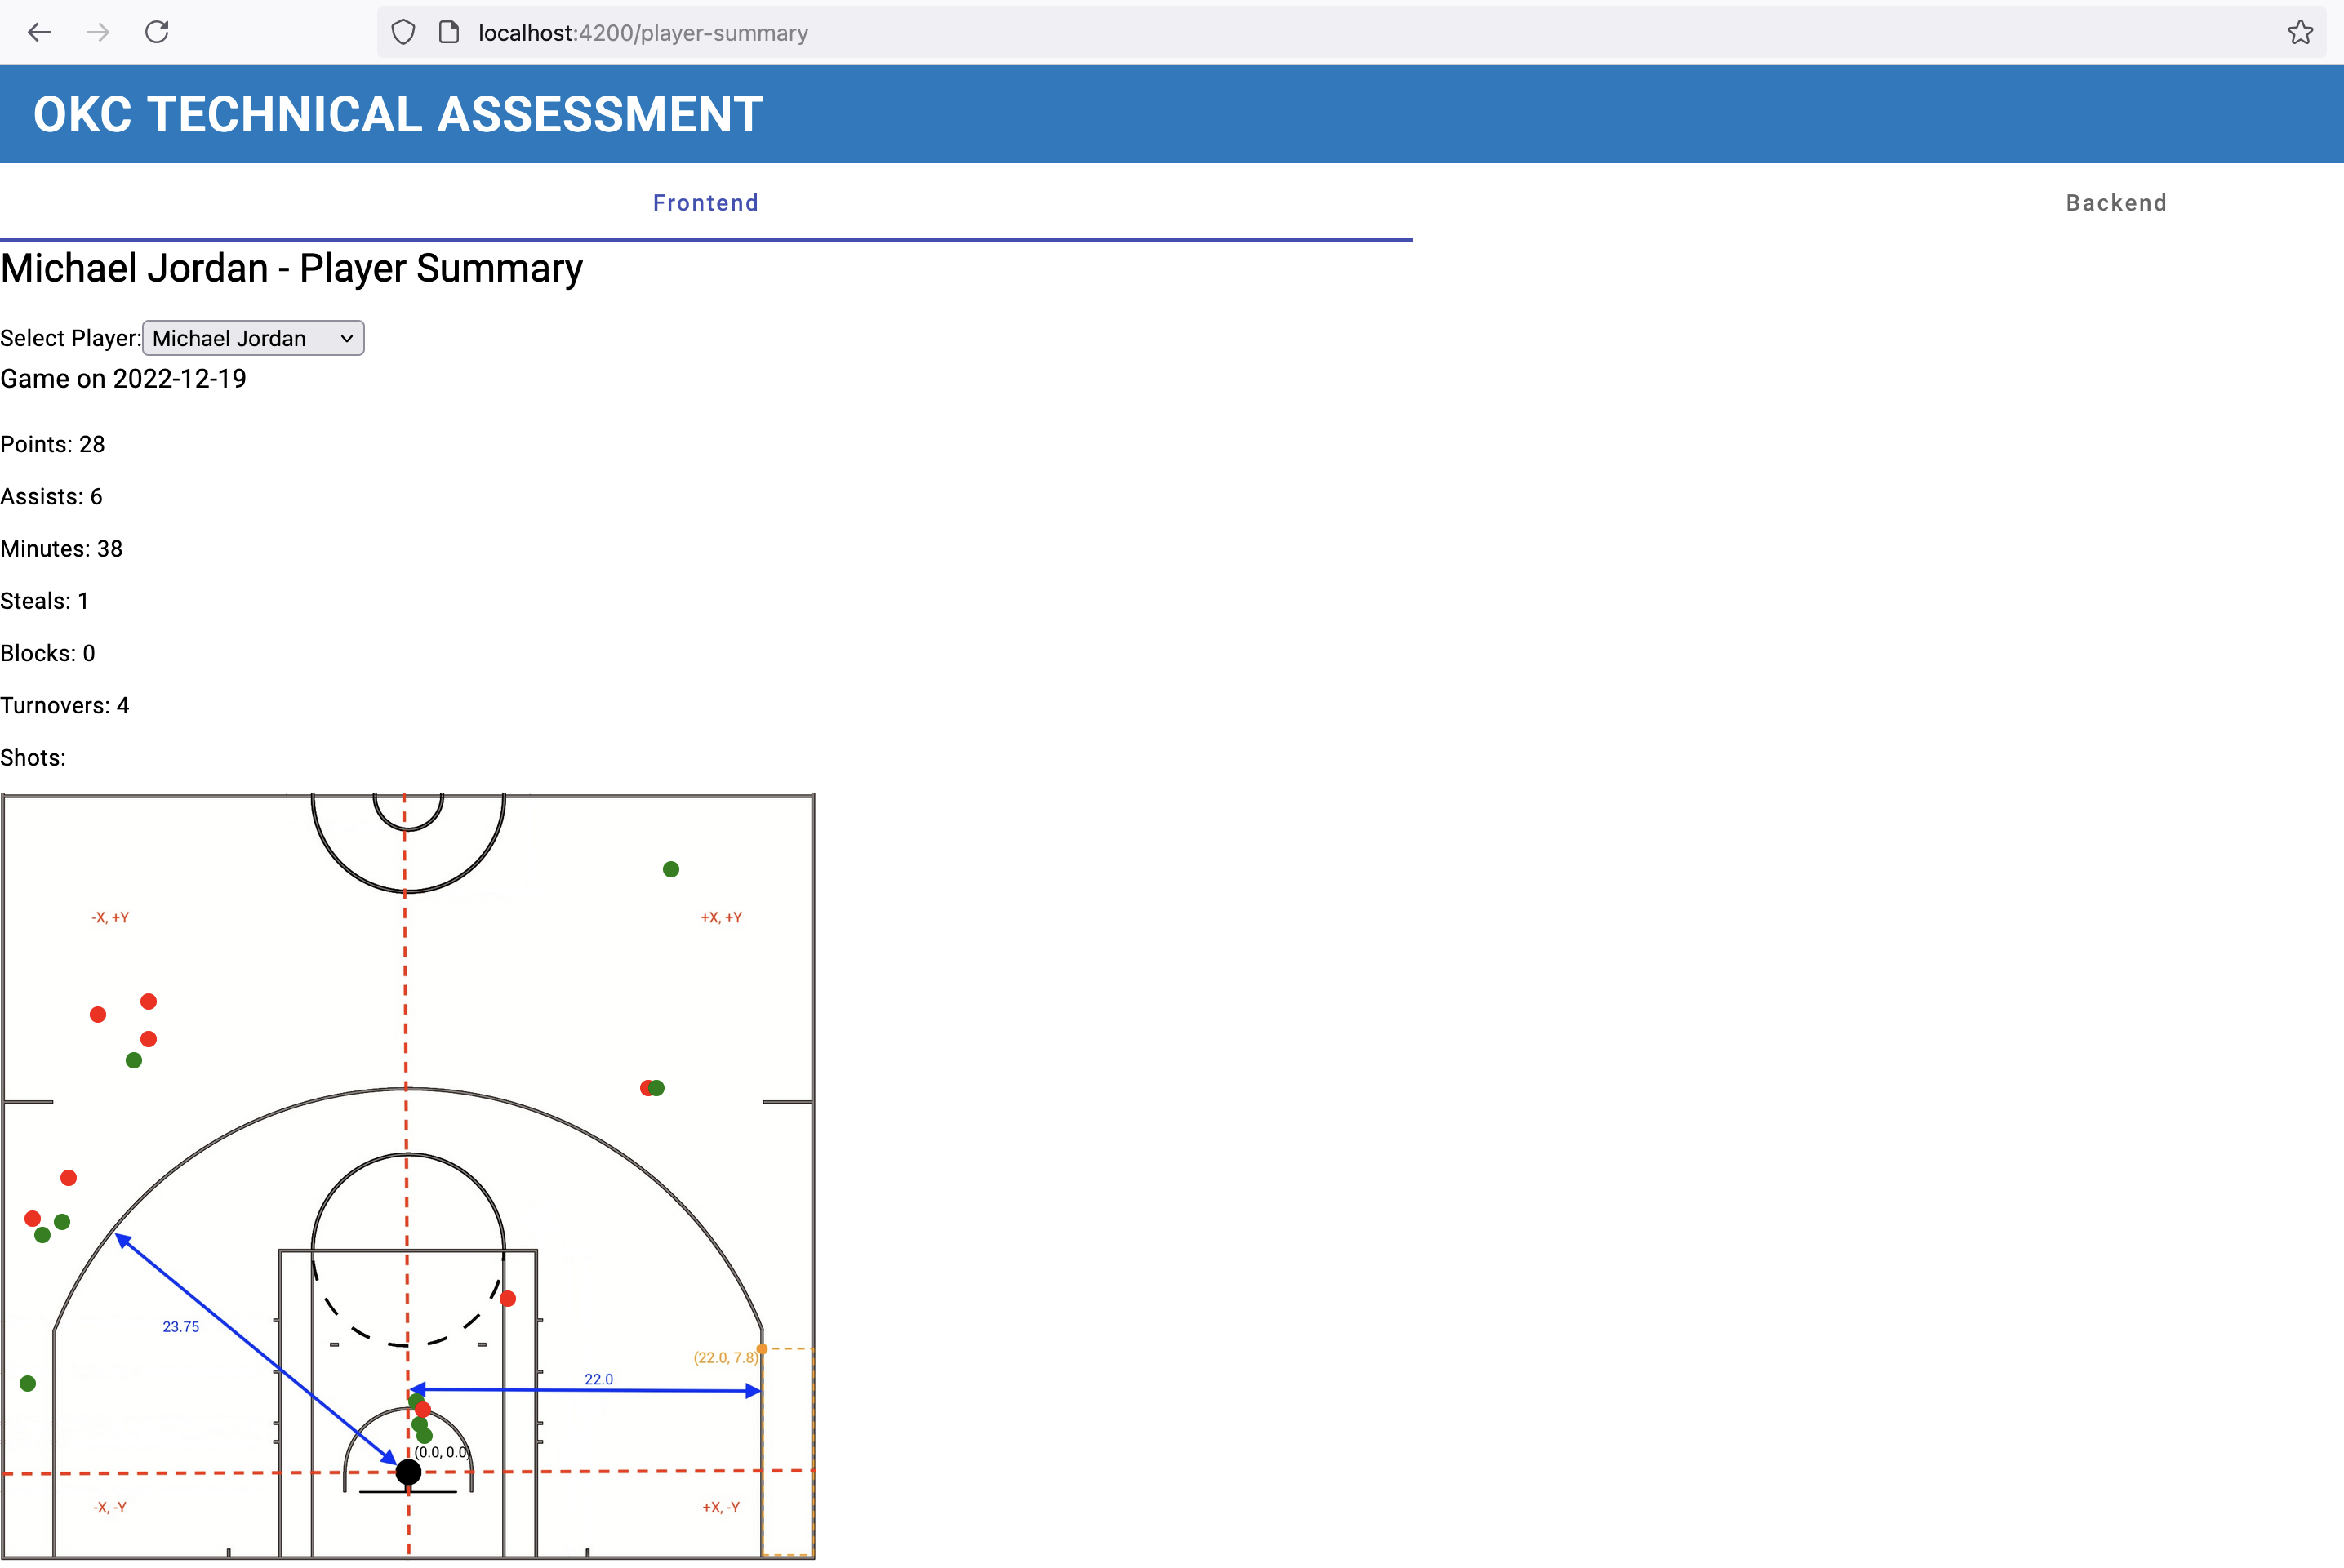
For this project, I built an interactive shot chart that visualizes player performance using an Angular frontend and a Django backend. The application allows users to select a player and retrieve detailed game statistics and shot locations, displaying the data in an intuitive, interactive format.
The backend is built using Django REST Framework (DRF) and serves as the API layer for retrieving player statistics and shot data. The system processes requests for individual player summaries, returning game-by-game performance metrics such as points, assists, rebounds, steals, and turnovers, along with shot attempts, shot locations, and success rates. The API structures data efficiently to support fast retrieval and ensure seamless integration with the frontend.
The frontend, developed with Angular, provides a dynamic and interactive UI for visualizing player performance. Users can select a player from a dropdown menu, which triggers an API request to retrieve their game data. The shot chart is built using D3.js and plots successful and missed shots on a basketball court diagram. Made shots appear in green, while missed shots are marked in red, allowing for clear performance insights.
This project highlights my ability to integrate backend API development with a modern frontend framework to create data-driven sports analytics applications. It demonstrates my expertise in Django, Angular, RESTful API design, and data visualization to deliver insights that enhance player performance analysis.