Dave Yount is the Founder & President of Sport Analytics - a startup company that teaches courses in sports analytics and provides professional certifications to the graduates. He is also a senior at Arizona State University, majoring in Business Data Analytics (B.S.) at the W.P. Carey School of Business. Projected to graduate Summa Cum Laude in May 2025. He has professional certifications in Baseball Analytics, Scouting, and Player Development. He previously worked as a Data Tracking Operator for the Milwaukee Brewers and a Baseball Research Intern for SABR.
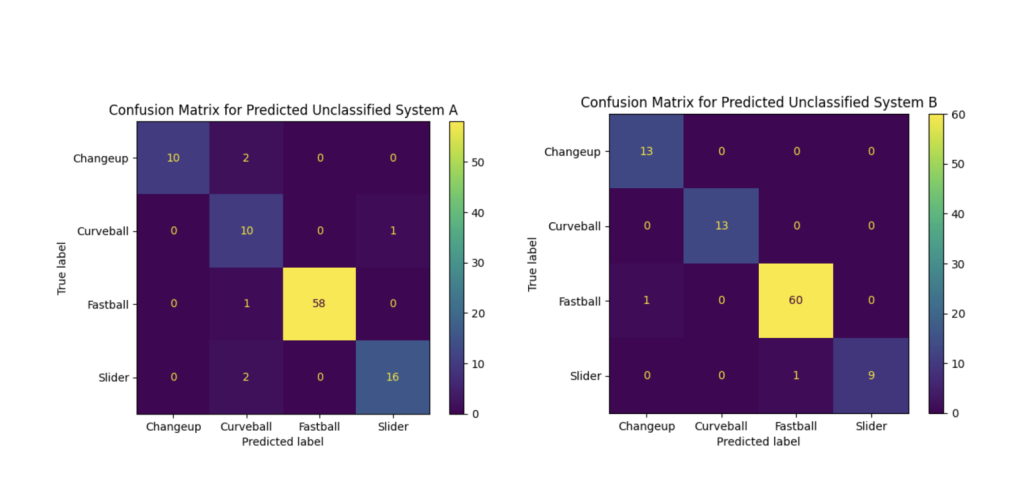
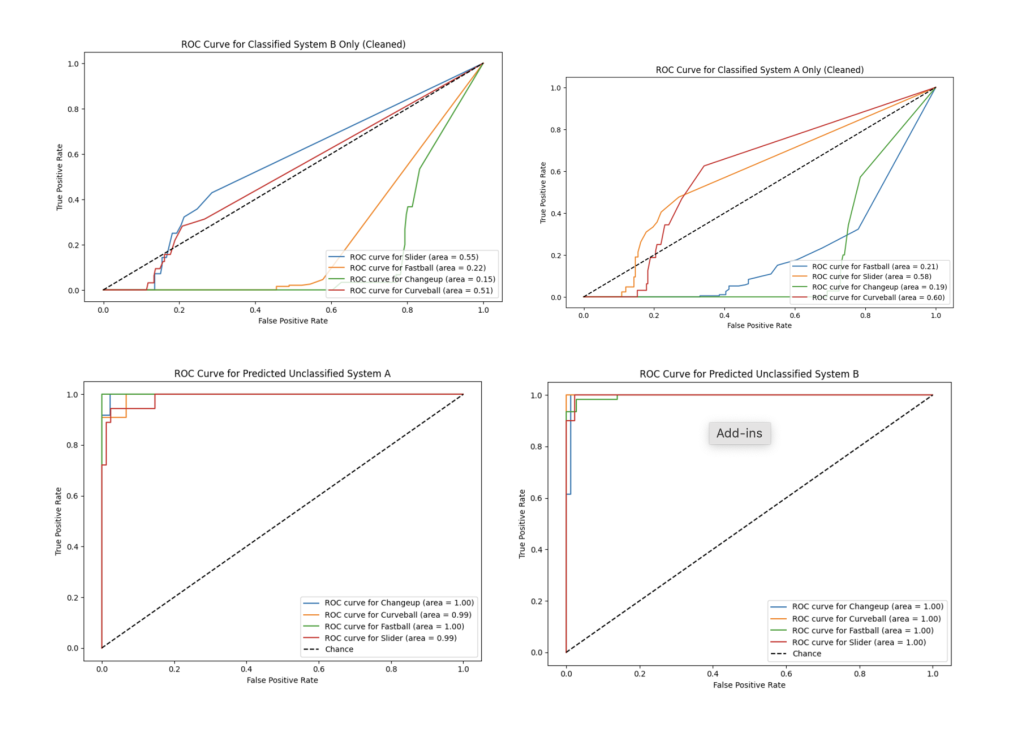
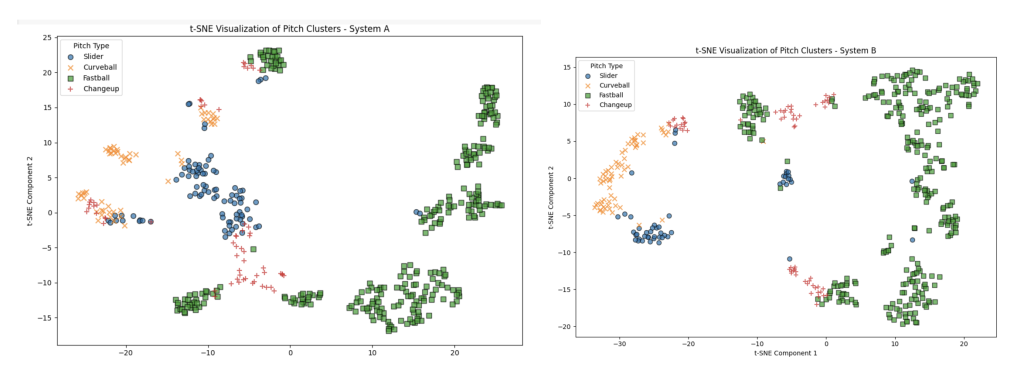
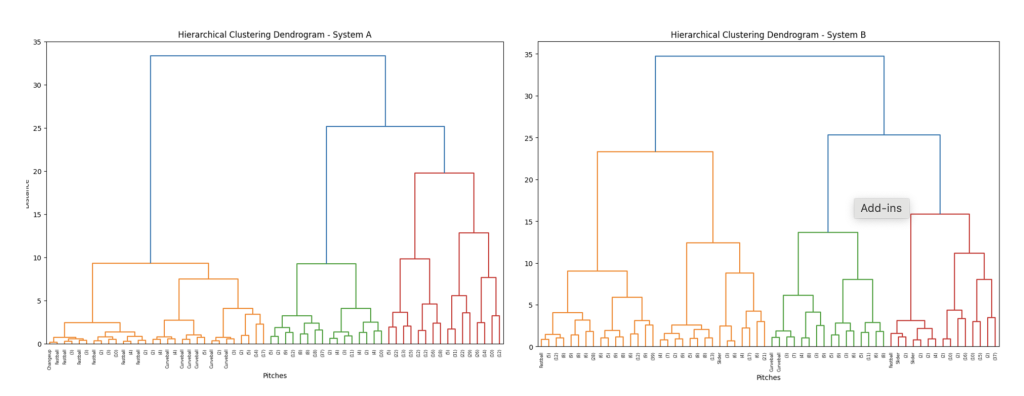
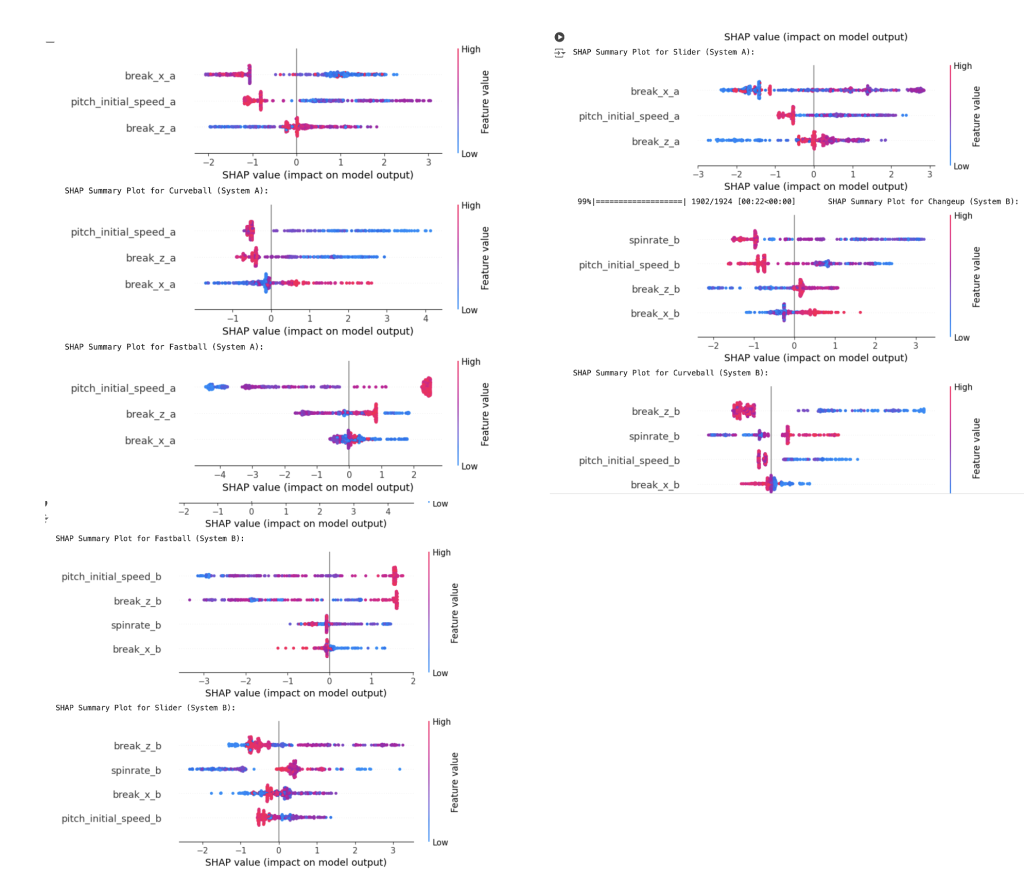
This analysis aimed to classify pitch types (Fastball, Slider, Curveball, Changeup) using various machine learning models, evaluate the performance of those models, and explore the role of different features in making accurate predictions. To achieve this, multiple methodologies and visualization techniques were employed, offering deep insights into the nuances of pitch classification. The results highlight the journey from using a Random Forest model as a baseline to leveraging XGBoost as the optimized model through hyperparameter tuning and feature engineering. This report includes the critical methodologies, challenges encountered, and advanced interpretative techniques used to achieve robust results.
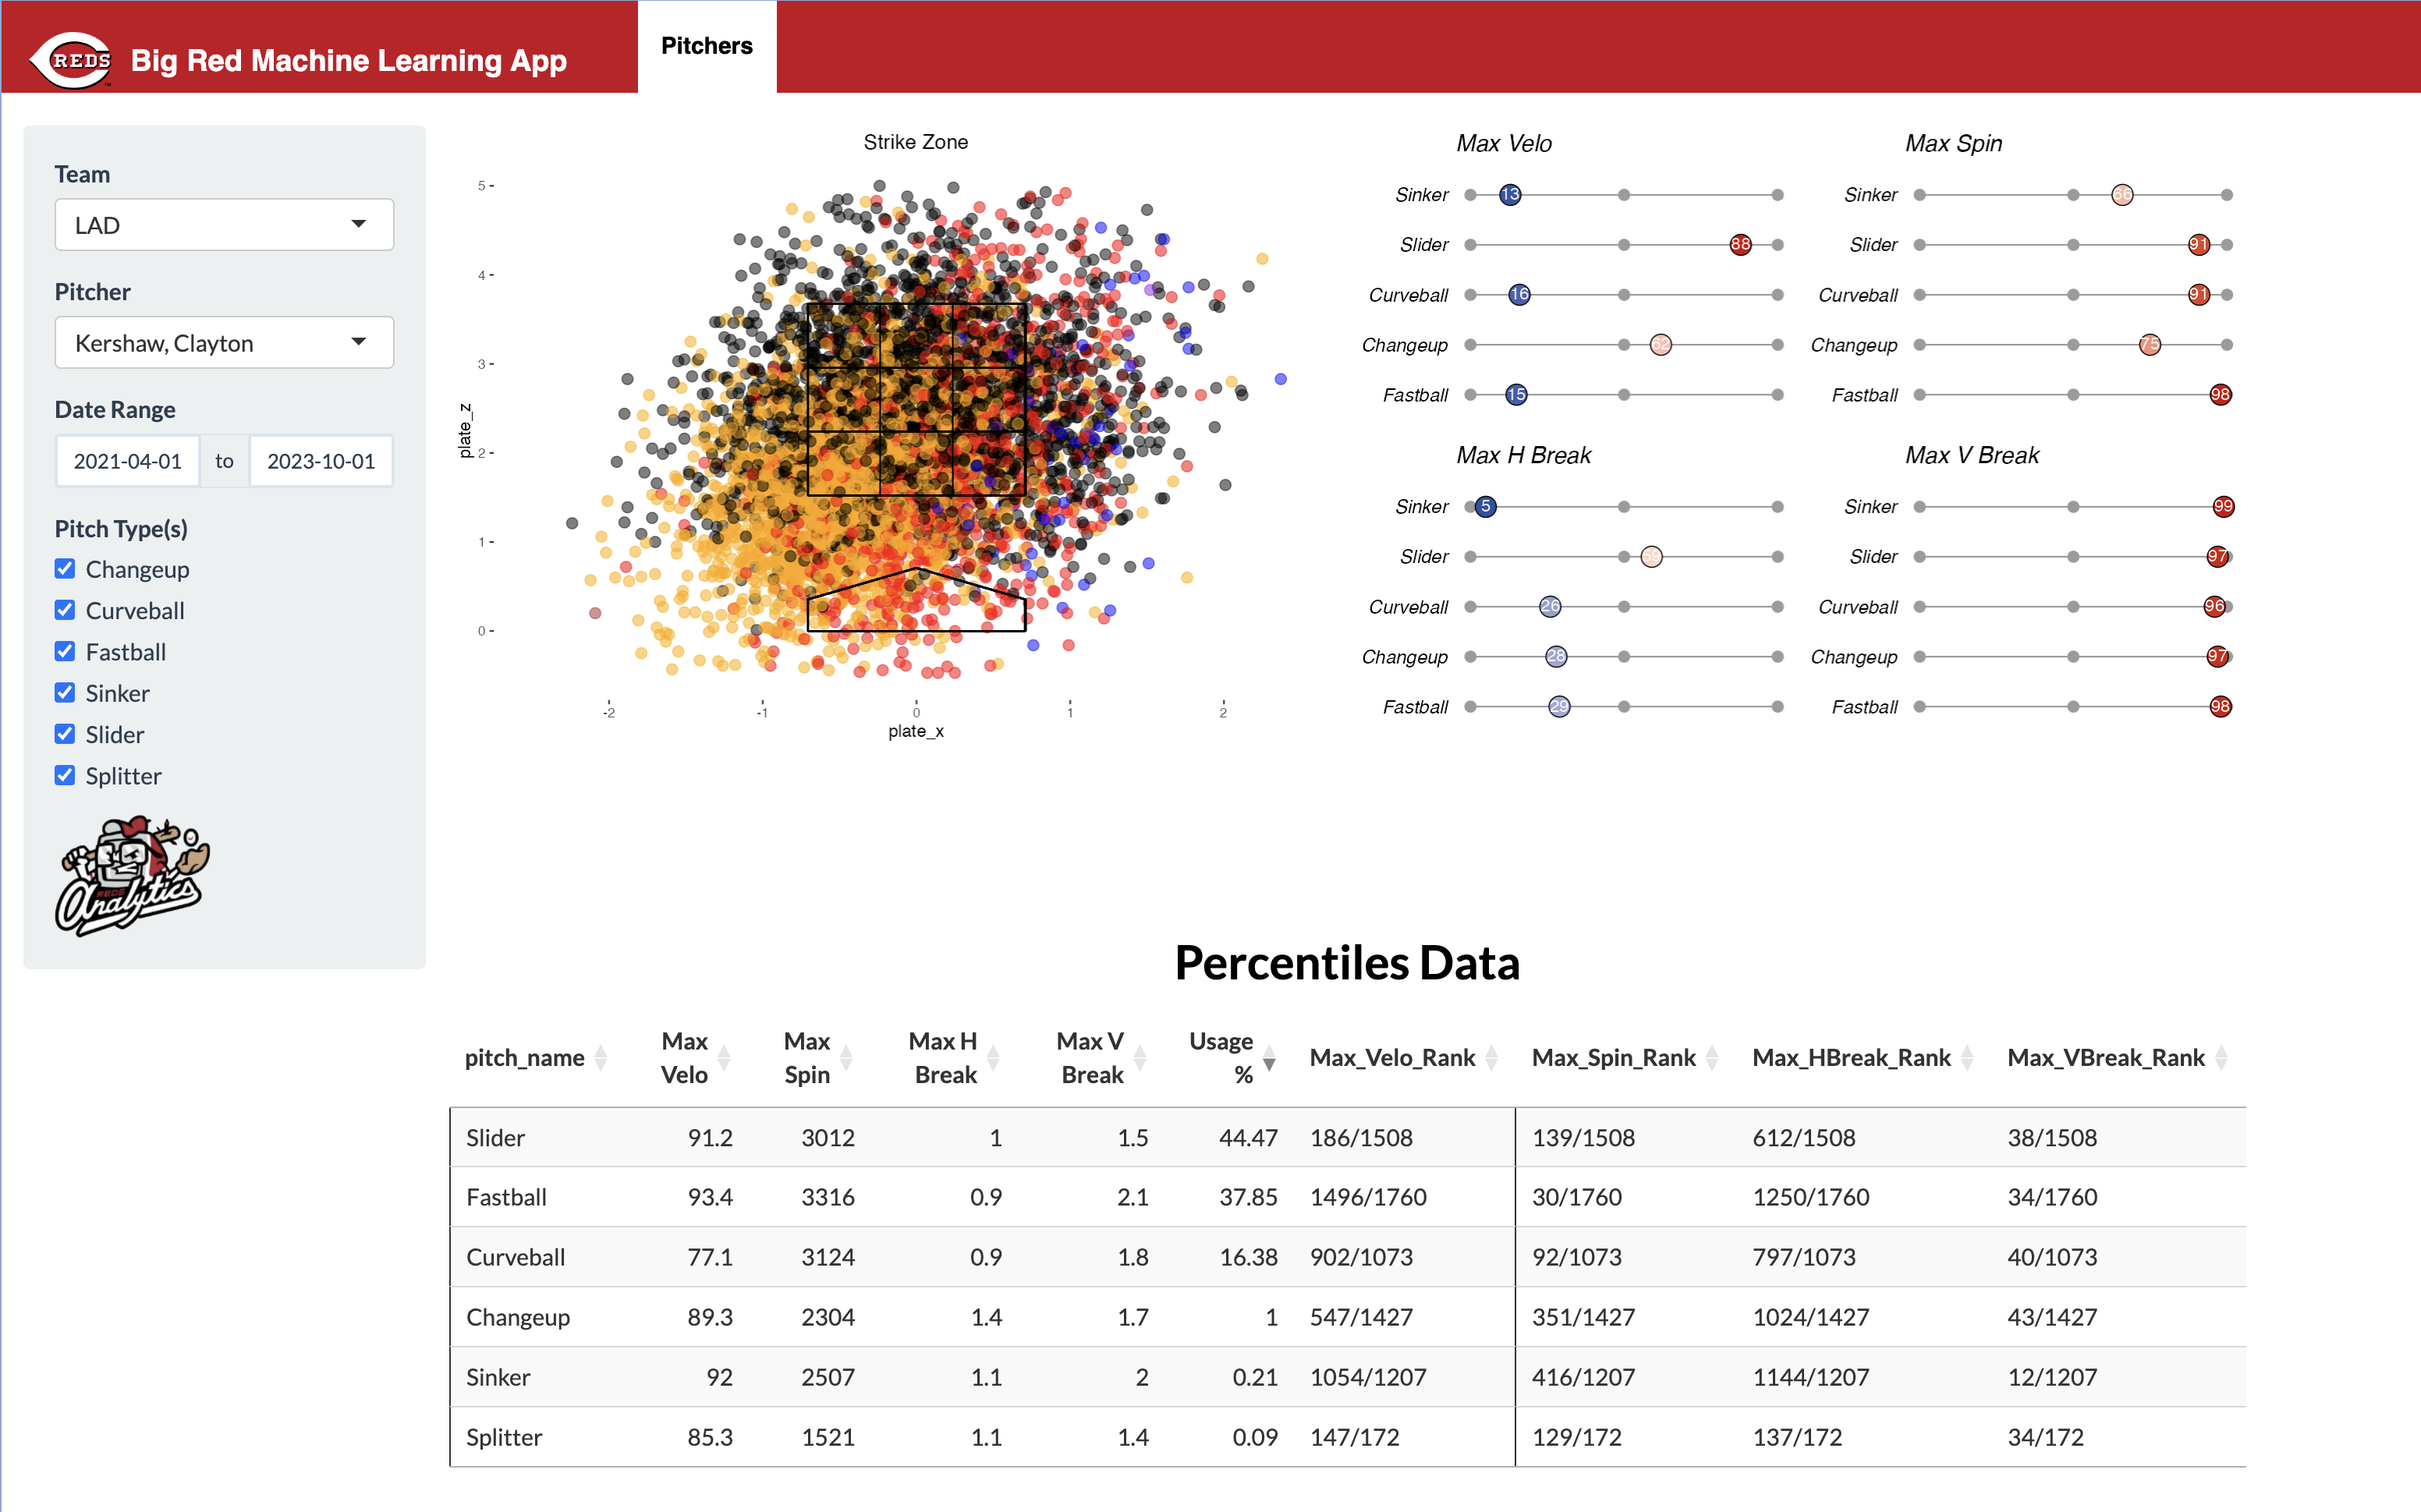
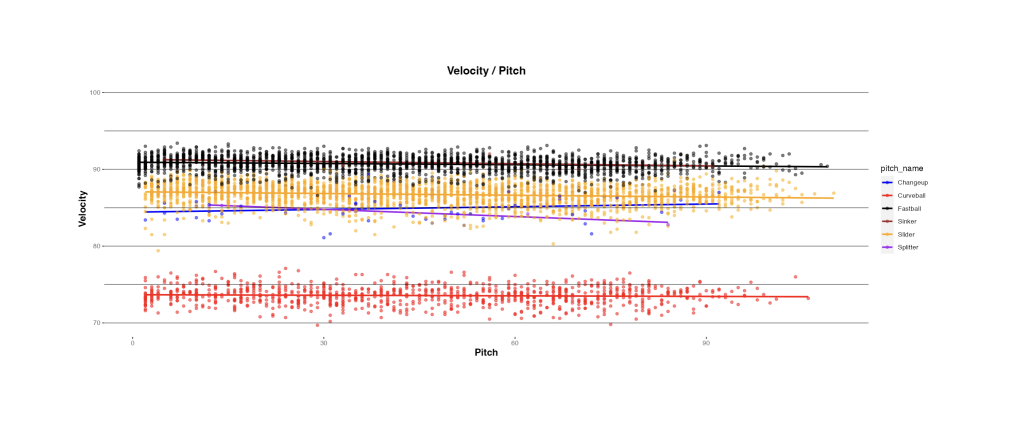
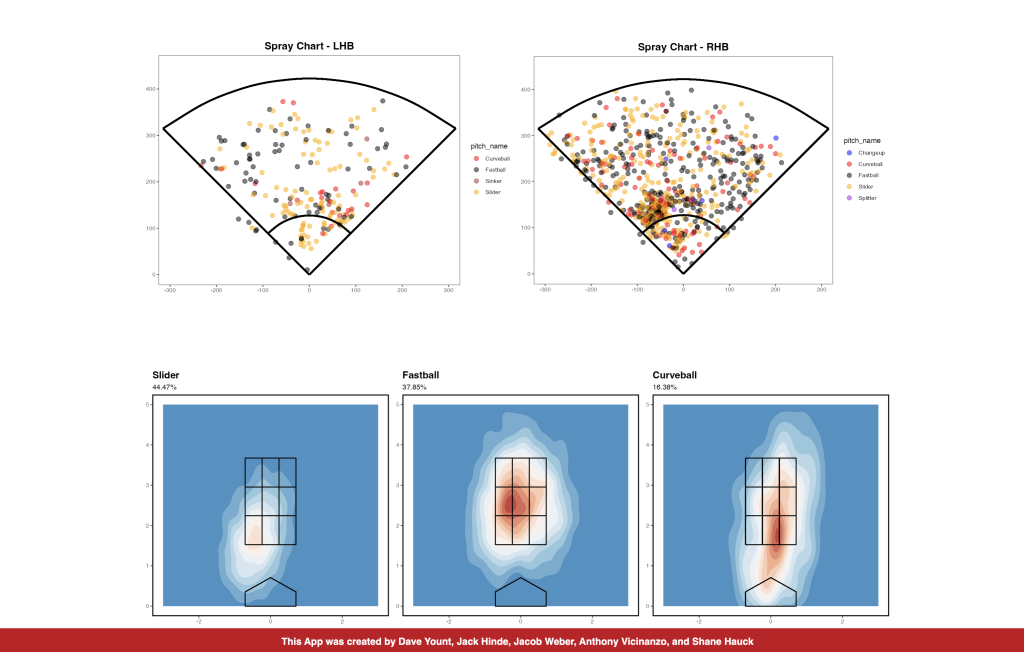
This study introduces an innovative approach to quantify pitcher fatigue, leveraging the rich data provided by the Statcast system. By focusing on detailed pitch-by-pitch data, we aim to uncover how fatigue affects various pitching metrics, potentially impacting a pitcher’s performance within a game. To complement our analytical framework, we also created a Shiny application, enabling a dynamic exploration of pitcher performance data. This tool allows for interactive analysis, offering users the ability to examine and identify pitchers who may benefit from role adjustments based on their fatigue profiles and performance metrics. Integrating this application into our study enriches the decision-making process, providing a practical platform for applying our findings to real-world baseball strategy and pitcher management.